A better way to evaluate NFL kickers
When you want to find out who the NFL’s best kickers are, the tools available to you tend to be pretty crude, with not much more than a record of makes and misses.
Here’s a snippet of statistics from Pro Football Reference:
| 0-19 | 0-19 | 20-29 | 20-29 | 30-39 | 30-39 | 40-49 | 40-49 | 50+ | 50+ | Overall | Overall | Overall | |||
|---|---|---|---|---|---|---|---|---|---|---|---|---|---|---|---|
| Rk | Player | Tm | FGA | FGM | FGA | FGM | FGA | FGM | FGA | FGM | FGA | FGM | FGA | FGM |
FG% ▼ |
| 1 | Jake Elliott | PHI | 6 | 6 | 4 | 4 | 3 | 3 | 1 | 1 | 14 | 14 | 100.0% | ||
| 2 | Josh Lambo | JAX | 8 | 8 | 9 | 9 | 7 | 6 | 1 | 1 | 25 | 24 | 96.0% | ||
| 3 | Justin Tucker | BAL | 7 | 7 | 6 | 6 | 7 | 6 | 1 | 1 | 21 | 20 | 95.2% | ||
| 4 | Mason Crosby | GNB | 2 | 2 | 6 | 6 | 5 | 4 | 1 | 1 | 14 | 13 | 92.9% | ||
| 5 | Chris Boswell | PIT | 1 | 1 | 8 | 8 | 4 | 4 | 8 | 7 | 2 | 1 | 23 | 21 | 91.3% |
| 6 | Younghoe Koo | ATL | 3 | 3 | 6 | 5 | 2 | 2 | 11 | 10 | 90.9% | ||||
| 7 | Zane Gonzalez | ARI | 10 | 10 | 11 | 10 | 6 | 4 | 2 | 2 | 29 | 26 | 89.7% | ||
| 8 | Dan Bailey | MIN | 6 | 6 | 4 | 4 | 5 | 3 | 2 | 2 | 17 | 15 | 88.2% | ||
| 9 | Matt Gay | TAM | 5 | 5 | 5 | 4 | 9 | 8 | 5 | 4 | 24 | 21 | 87.5% | ||
| 10 | Harrison Butker | KAN | 7 | 7 | 8 | 7 | 9 | 9 | 4 | 1 | 28 | 24 | 85.7% |
Goals
We want to know who the most accurate kickers are, but as might be somewhat apparent from the table, not all kicks are created equally. Zane Gonzalez, who at the moment leads the league in made field goals and ranks in the top 10 in FG%, also seems to have a high number of very short kicks relative to the other contenders. In other words, he’s had an easier path to the top of these leaderboards than some of the other contenders.
What would be nice is some way to account for difficulty of kicks when ranking the kickers. There’s more than distance to consider as well: wind, temperature, elevation, stadium conditions, and game situation are among the factors known or speculated to influence the difficulty of kicks. And since most kickers are playing half their games at the same stadium, kickers are bound to face quite different conditions from one another.
As far as concrete outputs are concerned, a few things would be nice:
- A rank ordering of kickers from best to worst
- A metric that tells us how a kicker performed compared to some reference level (e.g. average or replacement level)
- Some insight into the situational factors that influence whether a kick is made.
Data
The most important thing we need is data on whether field goals are made and
missed. Thankfully, Ron Yurko has been collecting all of the
NFL’s play-by-play data via his
nflscrapR package going back to 2009 and up through this week’s Thursday
night game.
I downloaded those files, filtered
to just get the plays with field goal attempts, and voila, I got the essentials:
- Field goal distance
- Field goal result
- Kicker
- Date of game
- Situation (score, time of game, etc.)
Using what I knew from the play-by-play data, I scraped more metadata from Pro Football Reference which got me:
- Location of game (including the stadium)
- Whether the stadium is outdoors, a dome, closed/open retractable roof
- Temperature and wind speed at kickoff
In my quest to get a sense of wind direction, I myself figured out the cardinal direction of every stadium. Then I scraped the following from NFLWeather.com:
- English-language summary of weather conditions (e.g., “party cloudy”)
- Temperature
- Wind speed
- Wind direction
- Precipitation probability
And for most recent games, and many others going back to 2009, NFLWeather has the data for each quarter of the games (approximately). Unfortunately, there is a lot of missing data on wind direction and precipitation probability. Using the wind direction data where available and the cardinal direction of the stadiums, I can calculate cross-winds. Unfortunately, this was kind of a bust and I won’t show you any models with cross-winds since it forces me to drop missing data and doesn’t improve model accuracy enough. Either due to accuracy issues in the data or because stadiums block/redirect the wind, just knowing the wind speed is just as good as knowing the direction.
Rather than use the oft-missing precipitation data, I used the verbal summaries and did some very basic natural language processing to create variables for whether it was raining, snowing, or foggy.
I also made variables to indicate whether the kicker was possibly iced, defined as the opposing team calling a timeout before the kick attempt. I also created a variable to indicate whether the kick both: 1. occurred in the 4th quarter/OT and 2. would tie the game or give the team the lead if made. I further note whether the game occurred in the playoffs or regular season.
Lastly, I made an effort to define a “replacement” kicker. Whether a kicker is performing poorly enough to be replaced depends on the likelihood that the typical “kicker on the street” would be expected to do in his place. To get a sense for the performance of replacement kickers, I tried to automatically classify a kicker in a given situation as a replacement. He was classified as a replacement if…
All of the following are true:
- He was not the first kicker the team used that season
- He wasn’t the team’s kicker the previous season (eliminates players coming back from a preseason injury)
- He wasn’t retained as the team’s kicker the next season (eliminates guys who won and then kept the jobs because they were clearly better than replacement)
or:
- He was the kicker for most/all of one season but was not retained for a second season.
There will still be some false positives and false negatives, but overall about 11.6% of kicks were attempted by replacement kickers by this definition. I point this out because for their statistics for all positions, Football Outsiders sets replacement level as the average performance of the bottom 10% of performers.
Model
So what predicts field goal success? Here’s how I put things together. I include the following factors:
- Distance
- Wind speed
- Temperature
- Whether it is rainy
- Whether it is snowy
- Whether is is foggy
- Whether the stadium is a dome
- Whether the game is a playoff game
- Whether the kick was game-tying/go-ahead late in the game
- Whether it is both a playoff game and the kick was game-tying/go-ahead late in the game
- Whether a timeout was just called by the opponent
- Whether the kick was game-tying/go-ahead late in the game and the opponent just called a timeout.
- Whether kicker plays for the home team
- Season (2010, 2011, etc.)
- Whether the kicker is a “replacement” kicker
- Adjustments for kicker ability
- Adjustments for stadium difficulty beyond those other factors
Results
Overall best kickers, 2009-2019
Let’s get down to business. A reminder about our key metrics:
- eFG%: What percentage we would have expected an average kicker to have for each kicker’s set of attempts
- rFG%: What percentage we would have expected a replacement-level kicker to have for each kicker’s set of attempts.
- PAA: How many more/fewer points the kicker generated than an average one.
- PAR: How many more/fewer points the kicker generated than a replacement-level one.
I’ve sorted the table below such that the kickers with the most PAA are first, but you can sort and search through the table however you want.
The modeling approach I used has some nice properties that deals with things like small sample sizes well, but the problem is how to express this information when the numbers produced don’t have a clear translation into football terms.
Here’s what I’ve done: I’ve let the statistical model predict how successful each kicker would be in hypothetical kicking situations, which should give us some feel for who has really established themselves enough to separate from the pack. Just as important, it can give you an idea about how much variance there really is in kicker talent. Worth noting is that to some extent, the model tends to assume that if there’s not a lot of data for a kicker, it’s probably because he is replacement level.
At 35 yards, the best kicker is predicted to have a 91% success rate while the worst is predicted to hit about 84%. Once you get to 50 yards, the difference grows to about 28 percentage points (72% vs 54%), which not only implies pretty noticeable differences in player value but also significant differences in the way coaches would need to adjust their decision-making regarding whether to even attempt a kick at that distance versus punting or going for it.
The unparalleled greatness of Justin Tucker
Justin Tucker is so great that, quite frankly, it doesn’t matter which metric you use. PAA, FG% - eFG%, or just plain old FG%, he’s unlike anyone else in the past 10 years. Given the well-documented trend of increasing kicker accuracy in the NFL, I think Tucker has a solid claim on being the greatest kicker of all time.
Even with fewer seasons than many of his competitors, his PAA are double all the others who kicked in the past 10 years. He had a slightly more difficult than average set of attempts but made a higher percentage of his attempts than anyone who has had more than 22 tries. Good luck trying to find any defect in Tucker’s record.
One way to talk about this is that if the Ravens had been cycling through replacement-level kickers since 2012 and letting them try the same field goals as they let Tucker attempt, they’d have scored 123 fewer points — that’s 17 fewer TD and nothing to sneeze at. And at 65 points better than average, even if you had the rare average kicker to replace him, you’d be 9 touchdowns worse off.
Nick Folk: Mr. Replacement Level
In my early efforts at creating this model, I did not set a replacement level and instead focused on points above average, a metric by which Nick Folk ranks clearly in last place. An implication of this, you’d think, might be that he’s been the worst kicker of the past 10 years. But not quite! Why has Folk stuck around so long, despite being so clearly below average? Because he has established a very long track record of being almost exactly replacement level.
His FG% - rFG%, over the course of 253 kicks, is .013, meaning he’s out-kicked a replacement kicker by just a single percentage point. He racks up about a single PAR per season. Nobody is going to get too excited about that, but you can imagine how teams might look at him as a very safe replacement — obviously, there’s no guarantee that a given replacement kicker won’t be worse than the average replacement, but teams tend to gamble on these unproven guys since they might also be better. A team can turn to Nick Folk if they’re more risk-averse and just want to get a guy who isn’t going to be a disaster.
Another interesting case in this vein is Mason Crosby, who has one of the worst PAA over his time in the league but who ranks in the top 20 (out of 96) in PAR. This is possible because he has spent a long time in the league and has occupied the space between average and replacement level. He’s been clearly better than replacement, but clearly worse than average.
Best seasons
We often don’t look at multi-year statistics like what I’ve just showed you, so it might also be interesting to see each kicker-season separately.
What a 2009 for Seabass! He had the most difficult set of kicks any full-time kicker faced in the past 10+ seasons and he hit 90% of them. I can’t help but wonder how high he would have ranked if my data encompassed the first 10 years of his very long career. I tend to think that if somebody is likely to have challenged Justin Tucker for the best modern kicker title, it might just be Sebastian Janikowski. If Janikowski hadn’t been one of the few first-round kicker draft picks and been beloved for his several eccentricities, he’d have the statistical profile of a massively underrated player.
A few notes about bad seasons:
- The aforementioned Mason Crosby actually looks like an average kicker if you exclude his dreadful 2012 season.
- Robbie Gould, one of the great all-time kickers and recent recipient of a 4-year, $19 million contract, is in the midst of one of the worst seasons of the past decade. He has dealt with a leg injury, though, so I wouldn’t be surprised if he has a strong finish.
Big legs and kick distance
One of the things prior attempts at statistically modeling differences between kickers have struggled with is picking up on differences between kickers in leg strength. There are some challenges to this, especially since coaches aren’t likely to let their kickers attempt kicks at hopeless distances. If the attempts don’t happen, it’s hard to statistically learn from them. Nevertheless, I think my method has a good shot at picking up on this and it seems to do so reasonably well, considering the inherent difficulties involved.
First of all, let’s look at what my model thinks the expected FG% is under average environmental conditions at various distances.
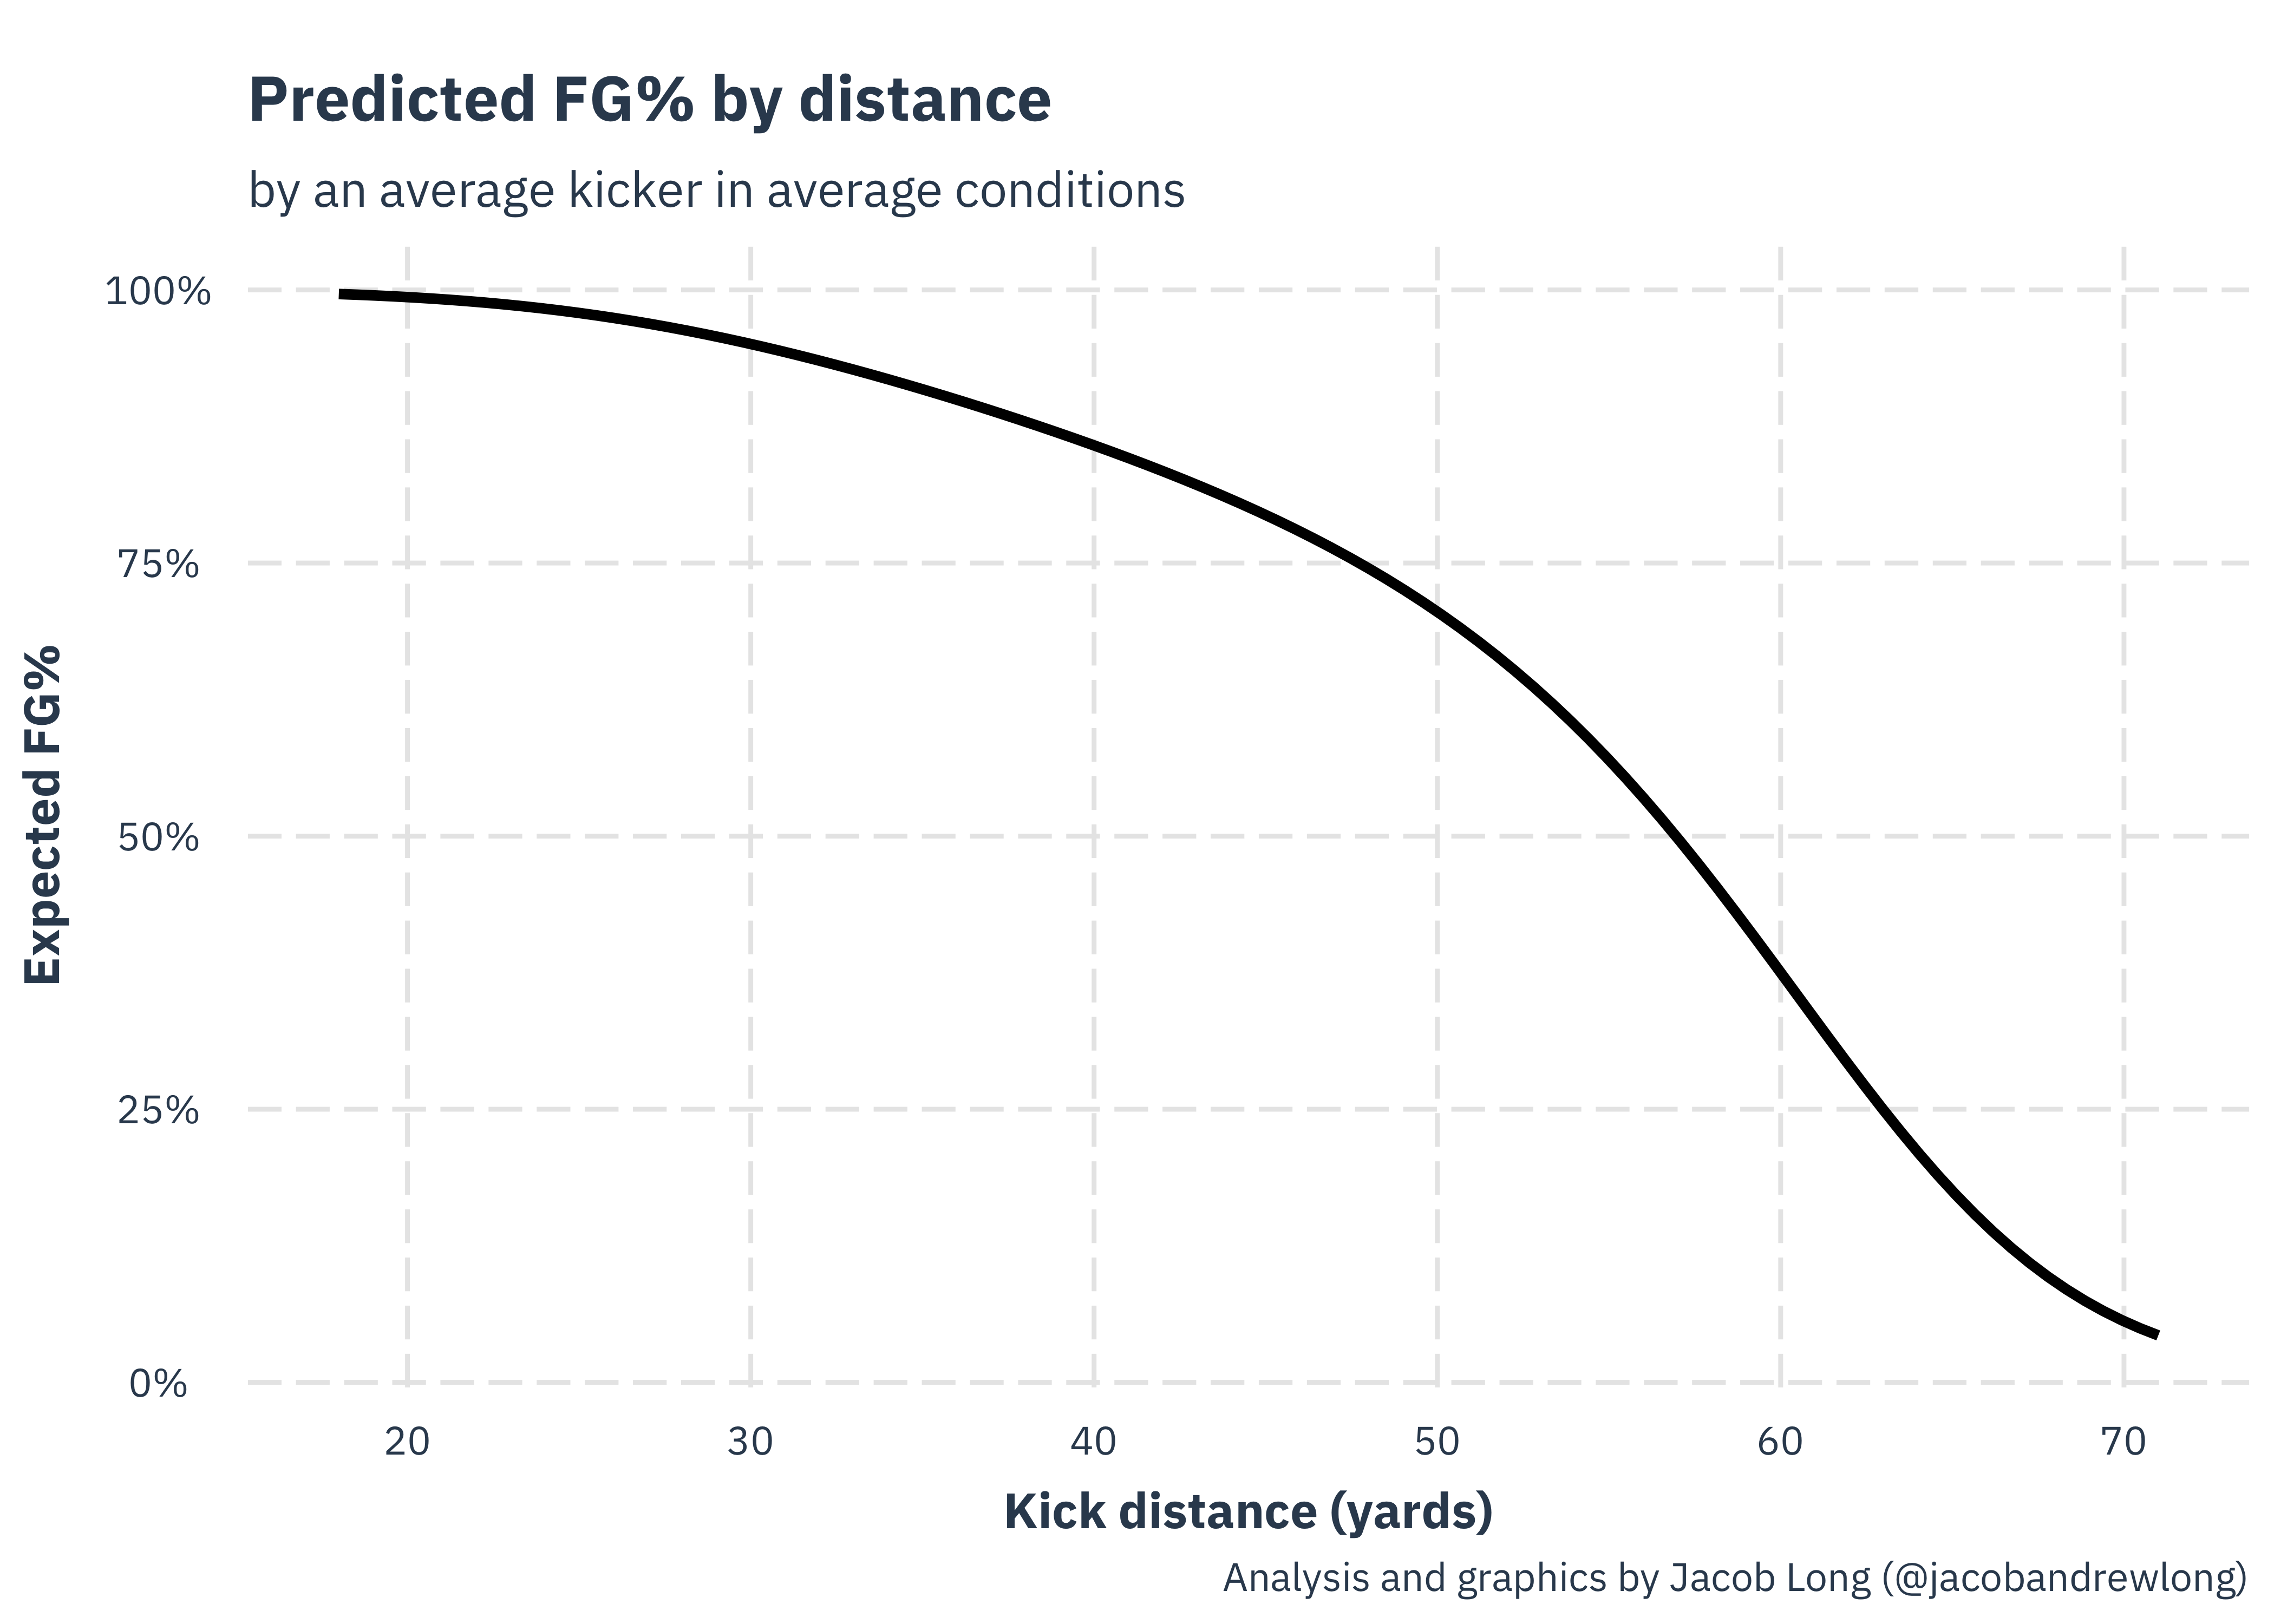
This seems, at first blush, pretty good. At 19-20 yards, it is just shy of 100%, which is basically how things work out in practice. Once you get out to about 70 yards, the model assigns around 1% probability, which is probably still too high but not too bad.
To see how closely the model’s assumptions about the effects of kick distance resemble reality, below I plot the same line but with points representing the actual NFL FG% at those distances (+/- 1 yard). The vertical lines represent the 95% confidence interval for the NFL FG%, since we know there’s some random error in those calculations.
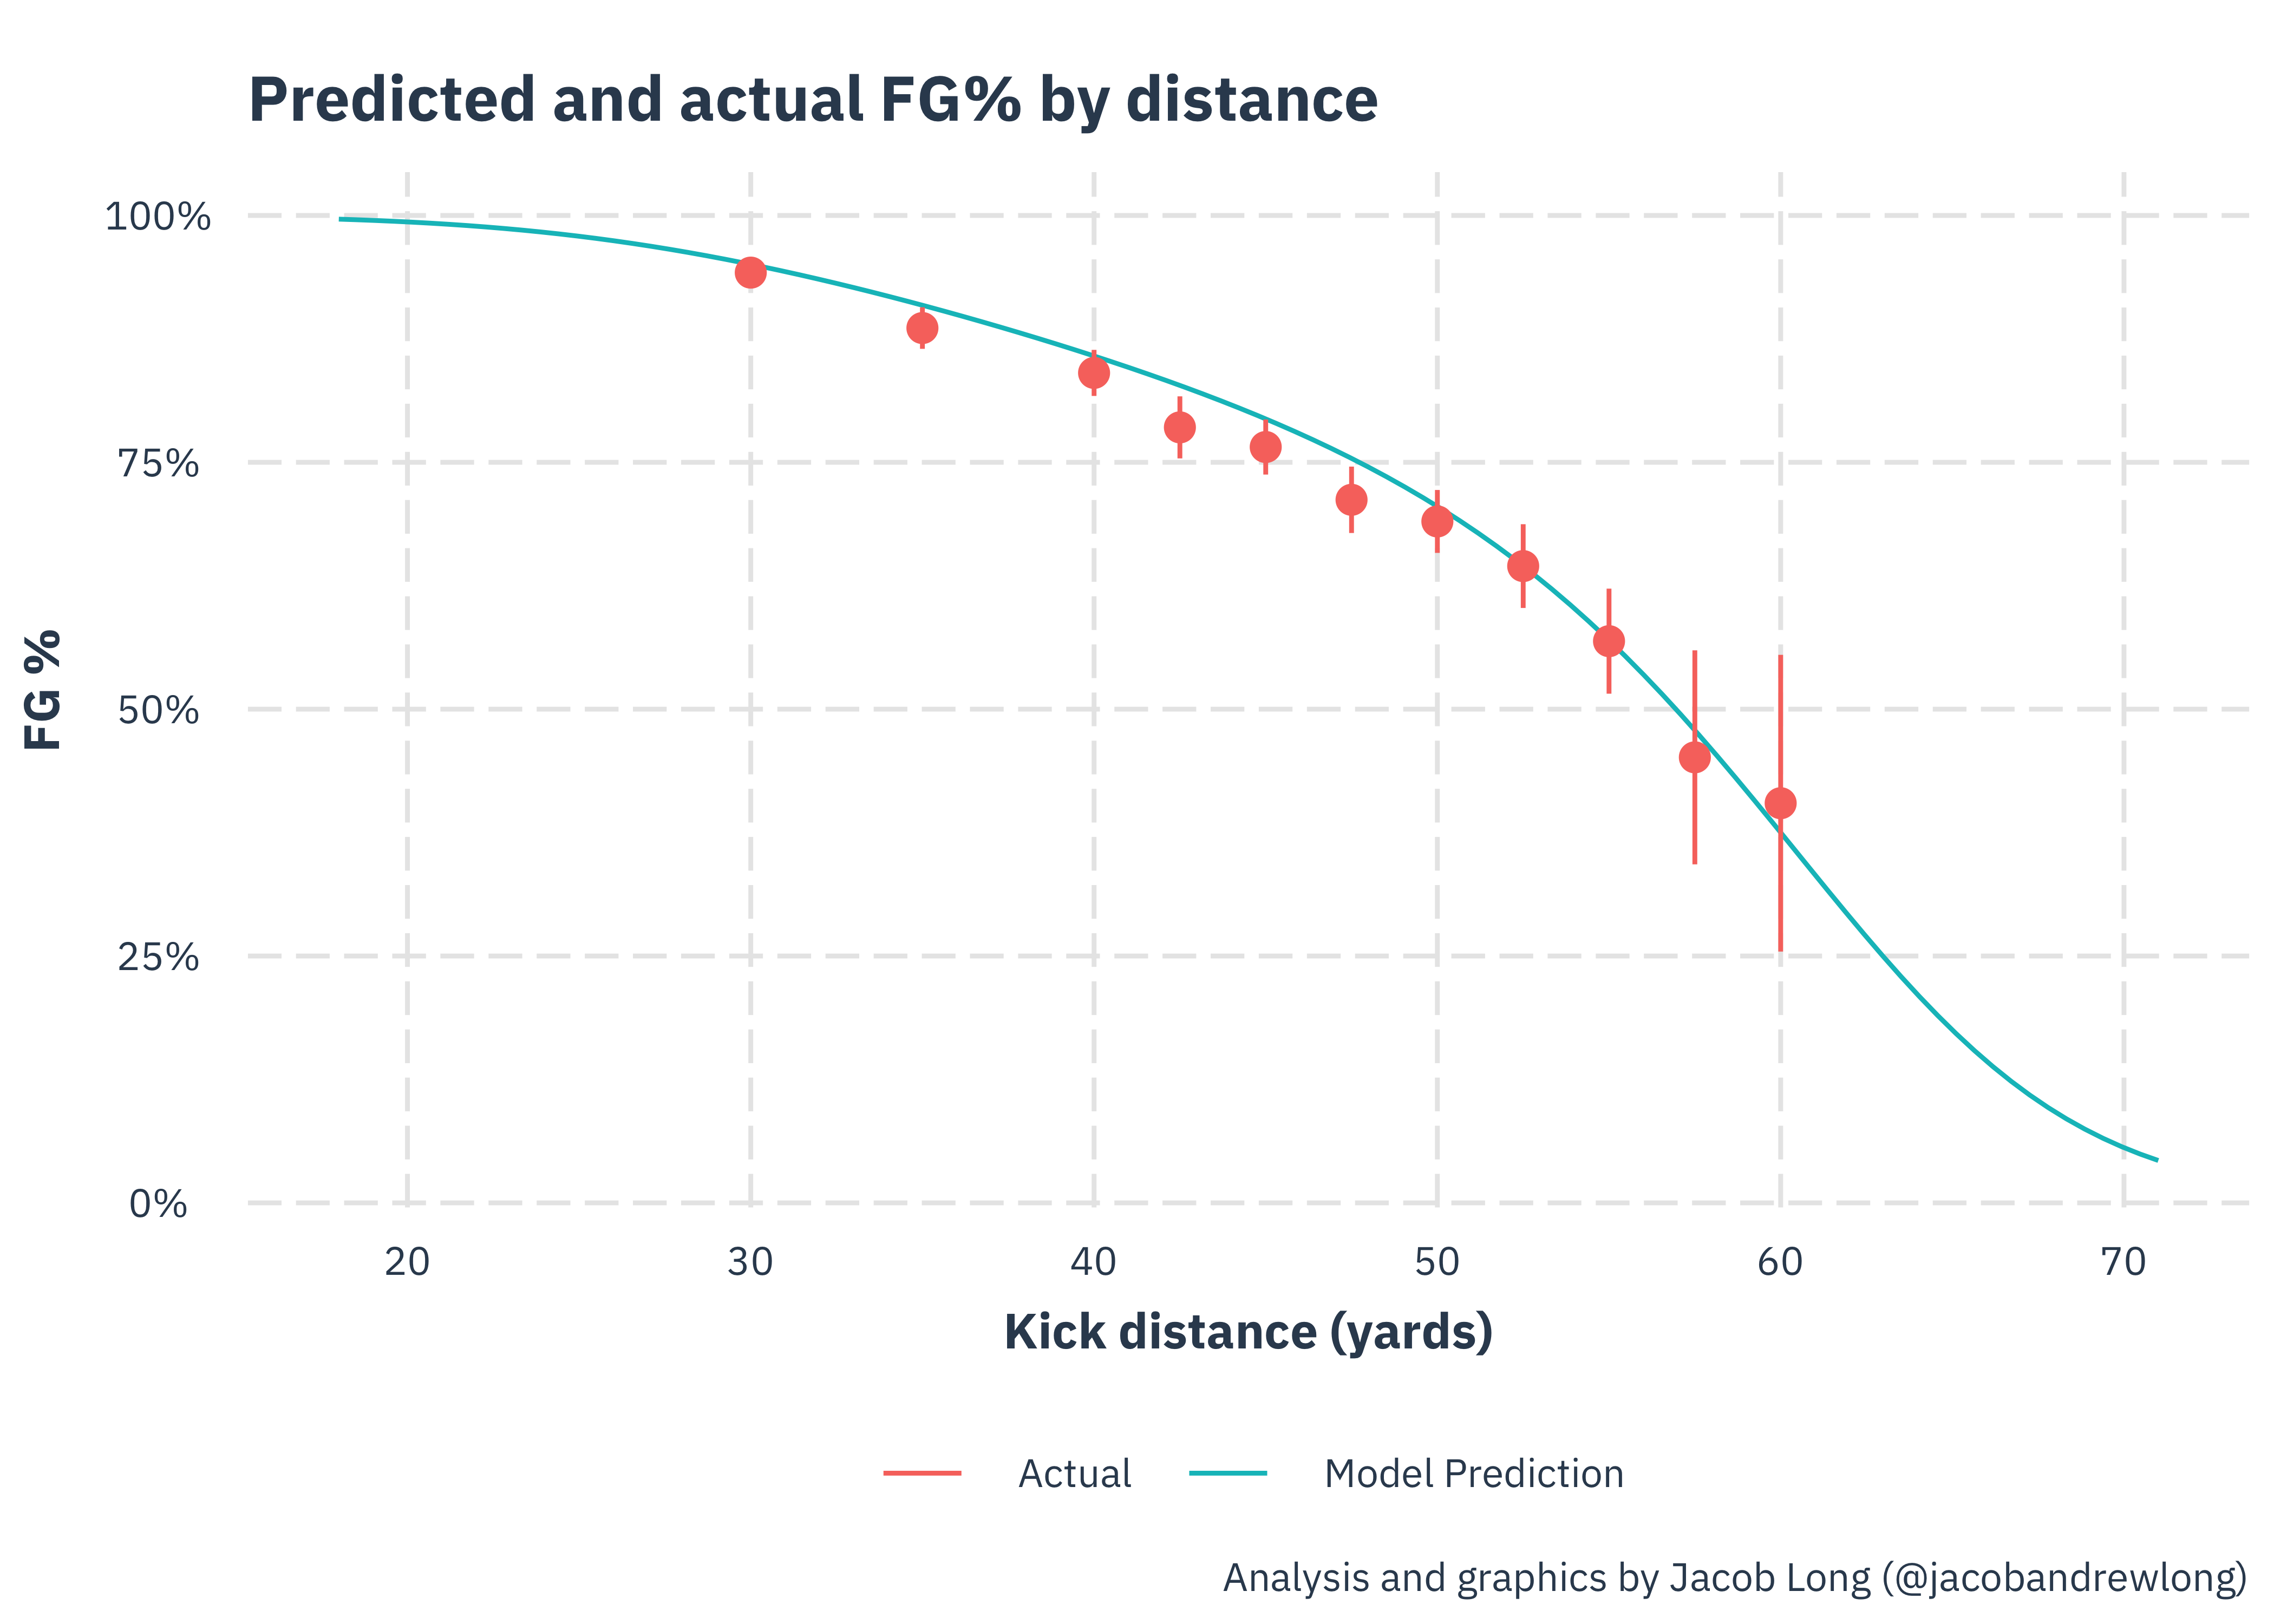
Overall, there is decent agreement here although it’s hard to know whether the slight differences are because of the model being wrong or just that the real-world kicks don’t all happen in “average” conditions.
So do some kickers have big legs? What I think about when it comes to a big leg is that there are two separate skills: accuracy and strength. A strong leg means you can make deeper kicks, at least insofar as your accuracy will allow. All NFL kickers can make 40 yard field goals, for instance, and so I consider that a distance where strength is only modestly influential. Once you get to 55 and 60 yards, those are kicks where you expect only the strong-legged kickers to have much success.
To illustrate how the model picks up on big legs, let’s take Adam Vinatieri and Matt Prater. At 45 yards, the model assigns these two basically equal probabilities of hitting a kick, both around 81%. At 60 yards, on the other hand, Vinatieri has a predicted 31% FG% while Prater has a much better predicted 44%. Here’s how their predicted success rate compares graphically:
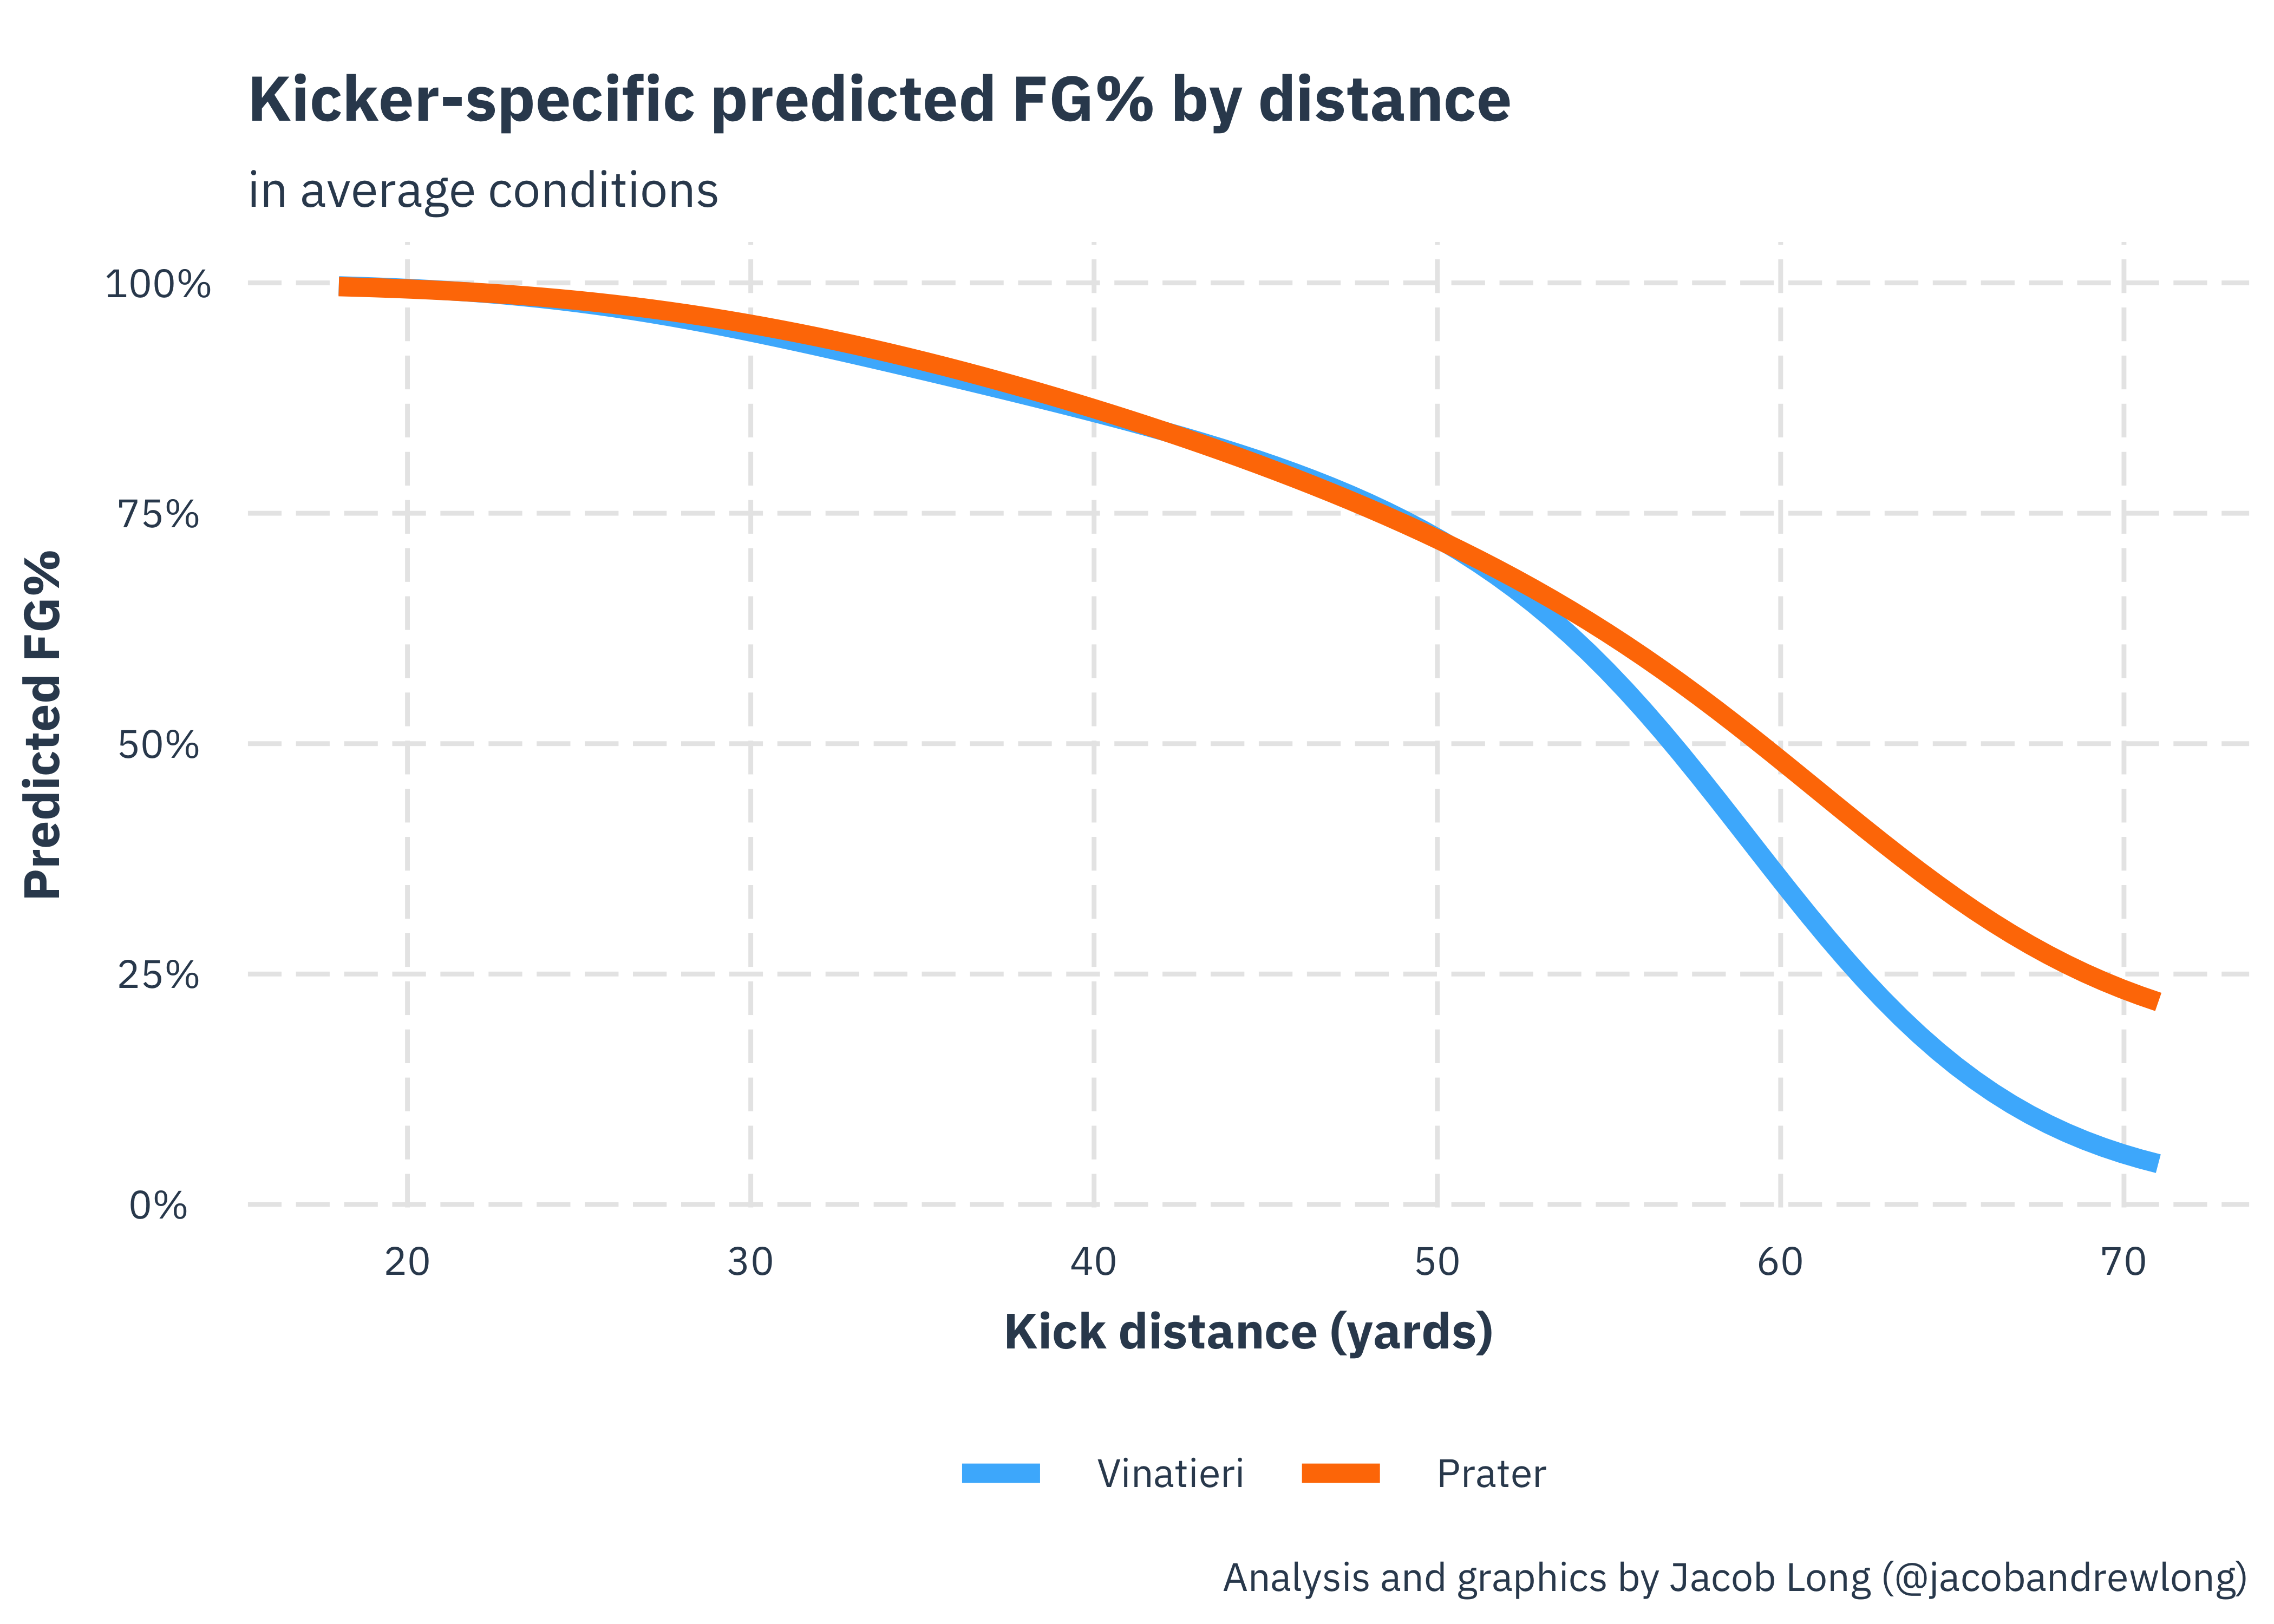
The model thinks they’re basically identical until you get to around 52 yards, at which point it strongly prefers Prater, who holds the distinction of having made the longest field goal in NFL history (64 yards). A number of kickers claim they hit longer field goals than this in practice settings, but the costs of missing field goals increase with the distance since the kicking team has to give their opponent the ball at the spot of the kick, so you aren’t going to see many coaches willing to take the risk under most circumstances.
Below is a table of predicted success rates for kickers at long distances.
Another worthwhile data point here is Brett Maher, a basically replacement -level kicker who at the moment is facing a fan revolt in Dallas (if Twitter is any indicator). The model sees him as around average at 45 yards, which may be generous (note that he did not meet the definition of a literal replacement kicker since Dallas retained him after his first season, so the model sees that as a signal he may be a legit starter). However, the model sees him as the second-likeliest to hit a 60 yard kick.
Why is this a useful sanity check for the model? Maher has the distinction of being the first kicker to ever successfully hit 3 attempts of 60+ yards, including one that was 63 yards. It seems to be a good sign for the model that it is flexible enough to see him as an unremarkable mid-range kicker but a uniquely strong-legged one.
Here’s a similar visualization with Maher included. Here you can see he’s clearly less reliable than the other two starting the late 30s of distance, but his accuracy doesn’t degrade at higher distances like the others, although Prater is still slightly favored all the way.

Clutch kicking
Once controlling for other factors, I don’t see any noteworthy effect of kicks that tie the game or put the kicker’s team in the lead late in the game, in general. But there are some nuances…
Don’t trust the replacements?
That being said, this may be because poor clutch performers get filtered out. I included a term in the model to see if replacement kickers perform worse at crunch time than would be expected (that is, even worse than the usual lower level of performance associated with replacement kickers). There is some fairly robust evidence for this. The model suggests that the probability that replacement-level kickers are particularly un-clutch is 98%1.
To show what the magnitude of this difference is, I’ve plotted the predicted FG% across the spectrum of kick distances for both replacement (orange line) and non-replacement (blue line) kickers. On the left-hand side, you see the predicted FG% in non-clutch situations and on the right, clutch situations. Note that clutch is defined here as game-tying or go-ahead field goals in the 4th quarter or later.
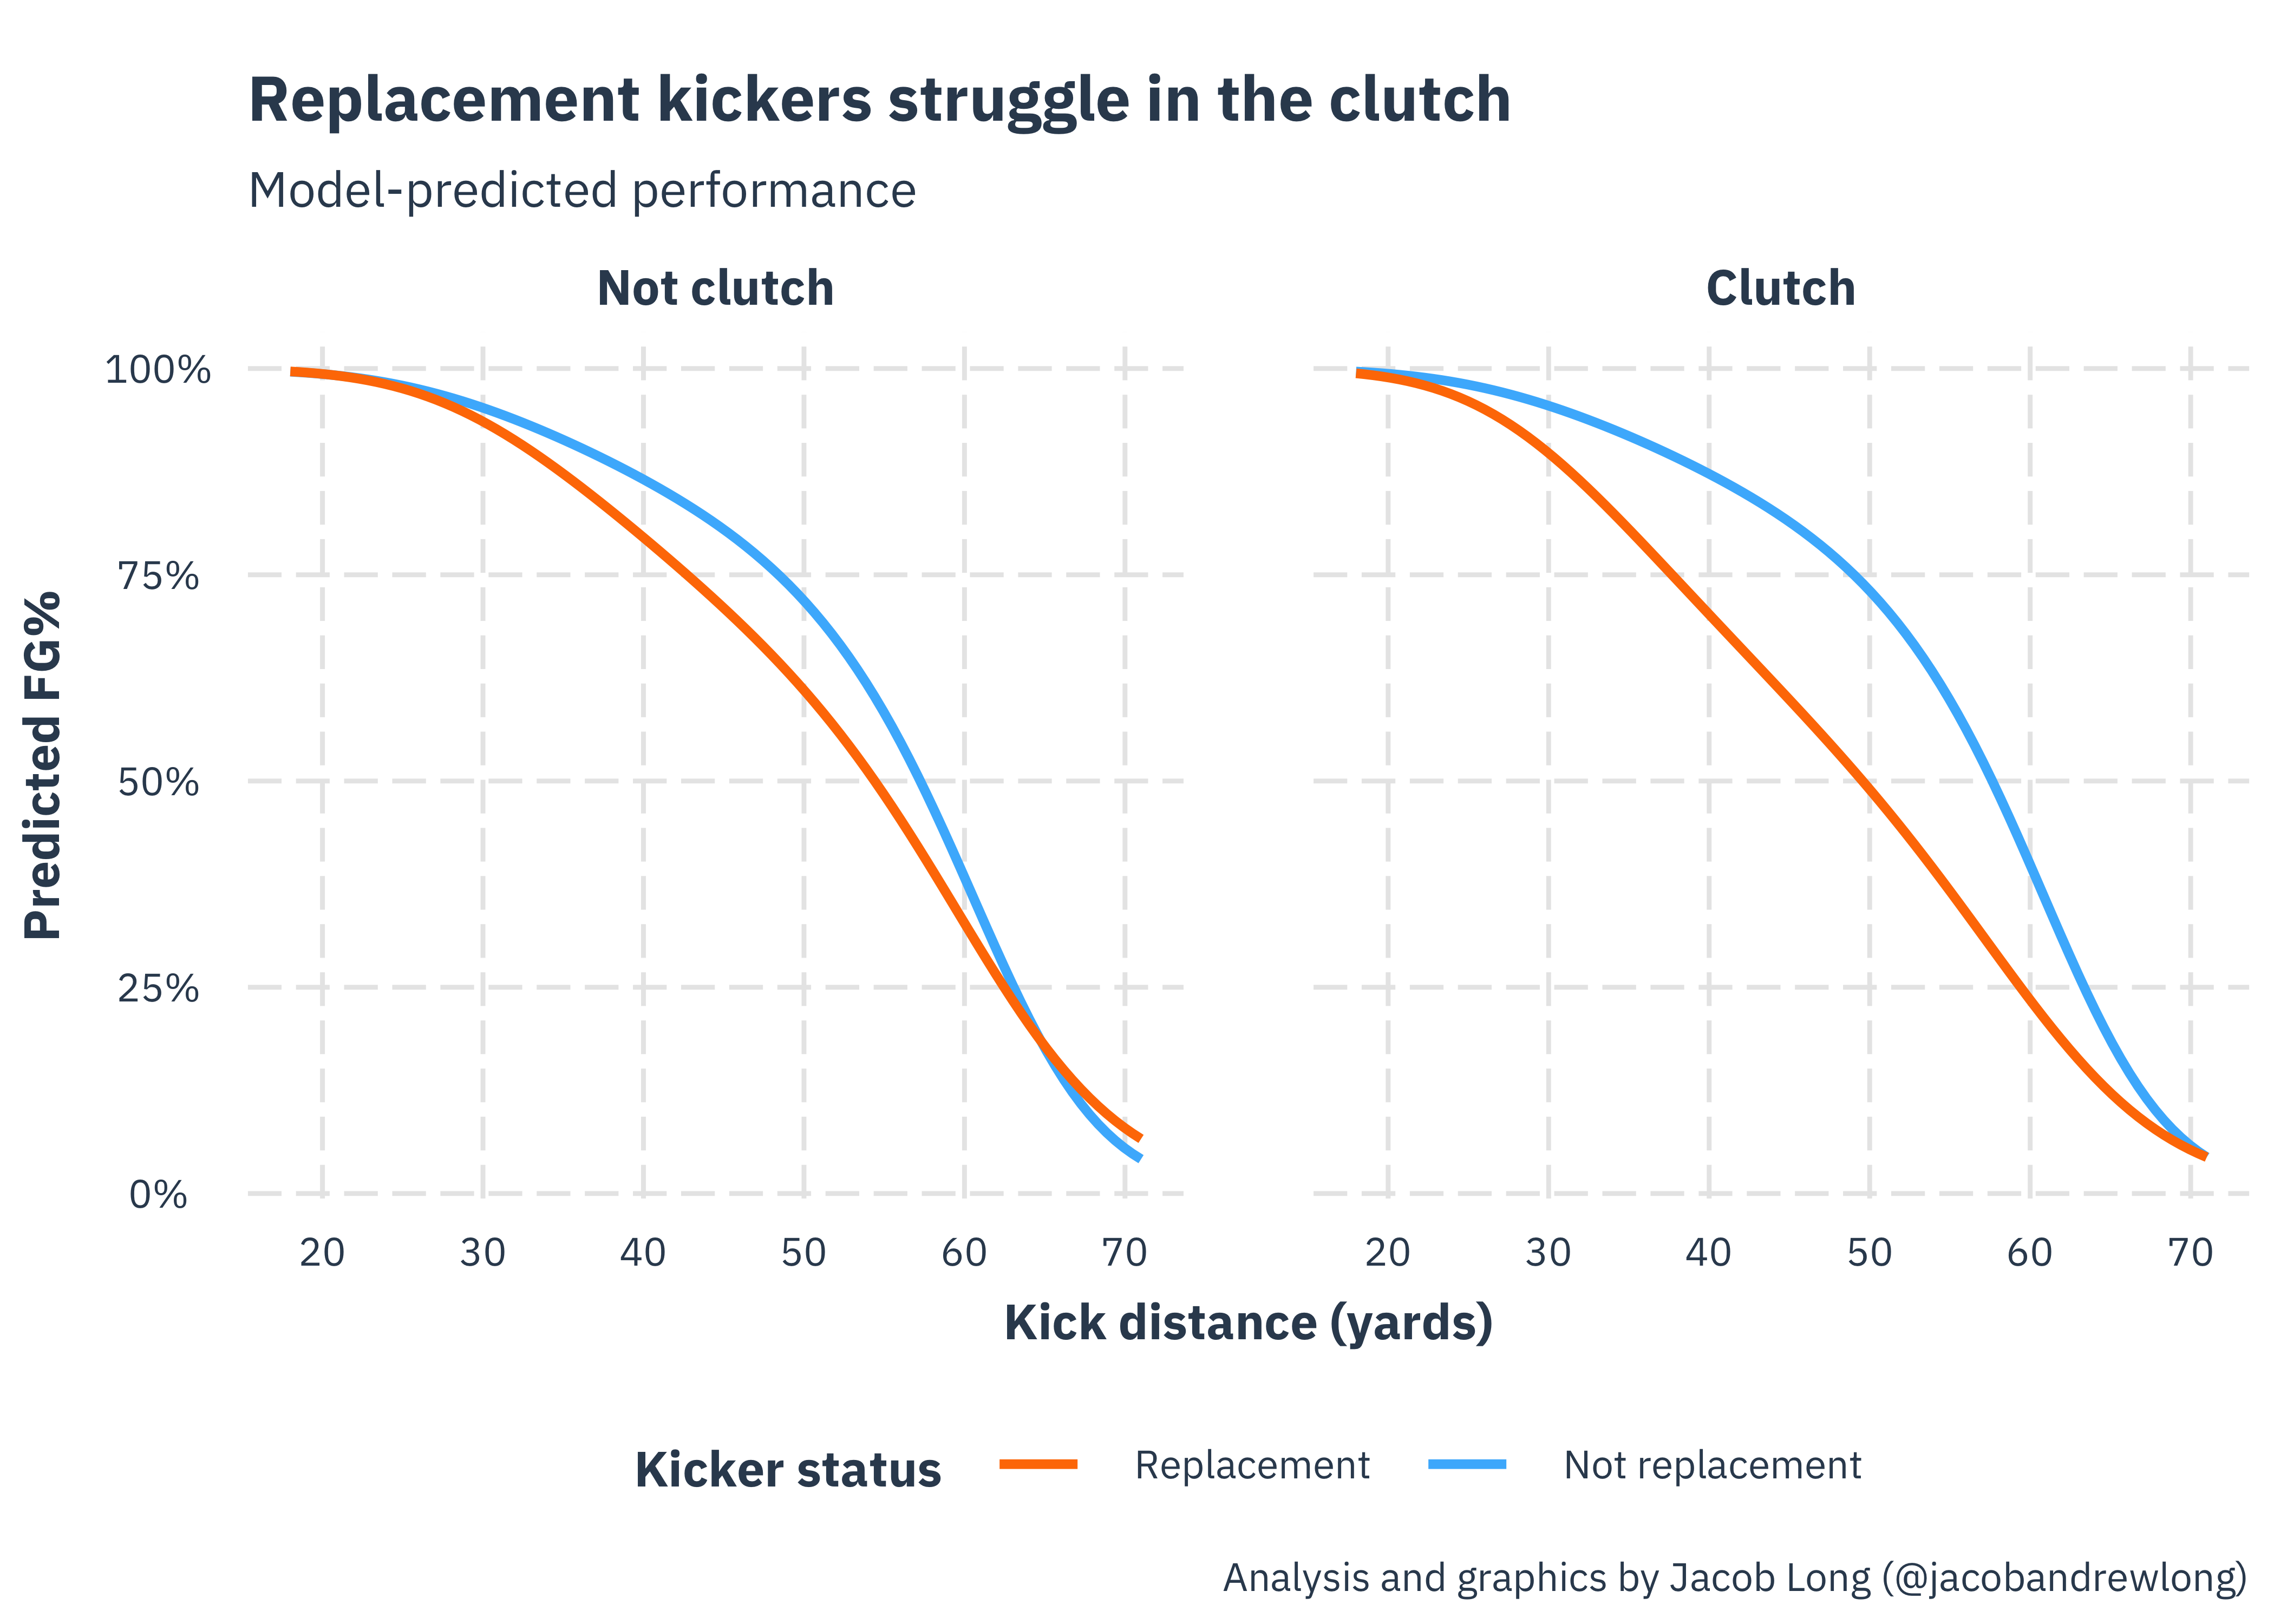
If you look closely, you can see that non-replacement kickers are unaffected by the situation. On the other hand, replacement kickers get noticeably worse in clutch situations. So while you generally are hurt by having a replacement kicker, you pay especially dearly in those clutch situations.
I do have to add one note of caution. The definition of replacement kicker I’ve applied partly depends on the kicker not keeping his job long-term. If GMs and coaches are more likely to fire their kickers for bad clutch performance, then that could bias these results to over-represent clutch misses among replacement kickers; indeed, it’s possible they are replacements because of their clutch misses.
“Clutch” kickers
Another advantage of my modeling approach is that it allows for the effect of game situation to be different for different kickers. In general, kickers are no better or worse than normal in clutch situations. But are some kickers better and others worse than their normal selves in such situations?
Well, to put it briefly, the results from the model don’t provide very compelling evidence of kickers who are especially clutch once you factor in all these other things, including whether they are/were a replacement kicker. There is an inherent difficulty in detecting such a thing, of course, because kickers don’t get many clutch opportunities. So I won’t say there’s no such thing, just that it doesn’t look particularly promising for there to be any evidence of a clutch skill — and don’t forget that there’s the added problem that bad clutch performance may get kickers fired and therefore they stop providing data. Maybe the league is populated with a bunch of really clutch kickers.
Icing
Put briefly, I see some weak evidence that icing the kicker may help. Overall, the model suggests a tiny, basically zero effect of having a timeout called by the opponent before a kick.
But for the combination of the kick tying the game or giving the team a lead late in the game and the kicker being iced, which is really the true icing situation, there is some modest evidence.
In the plot below, I show the model’s predicted probability of making a 40 yard field goal in 4 situations — each combination of kicks that would tie the game/put the kicker’s team ahead in the 4th quarter (I call these “clutch”) and kicks in which the opponent did/didn’t call a timeout before the kick (which I’m calling “icing”).
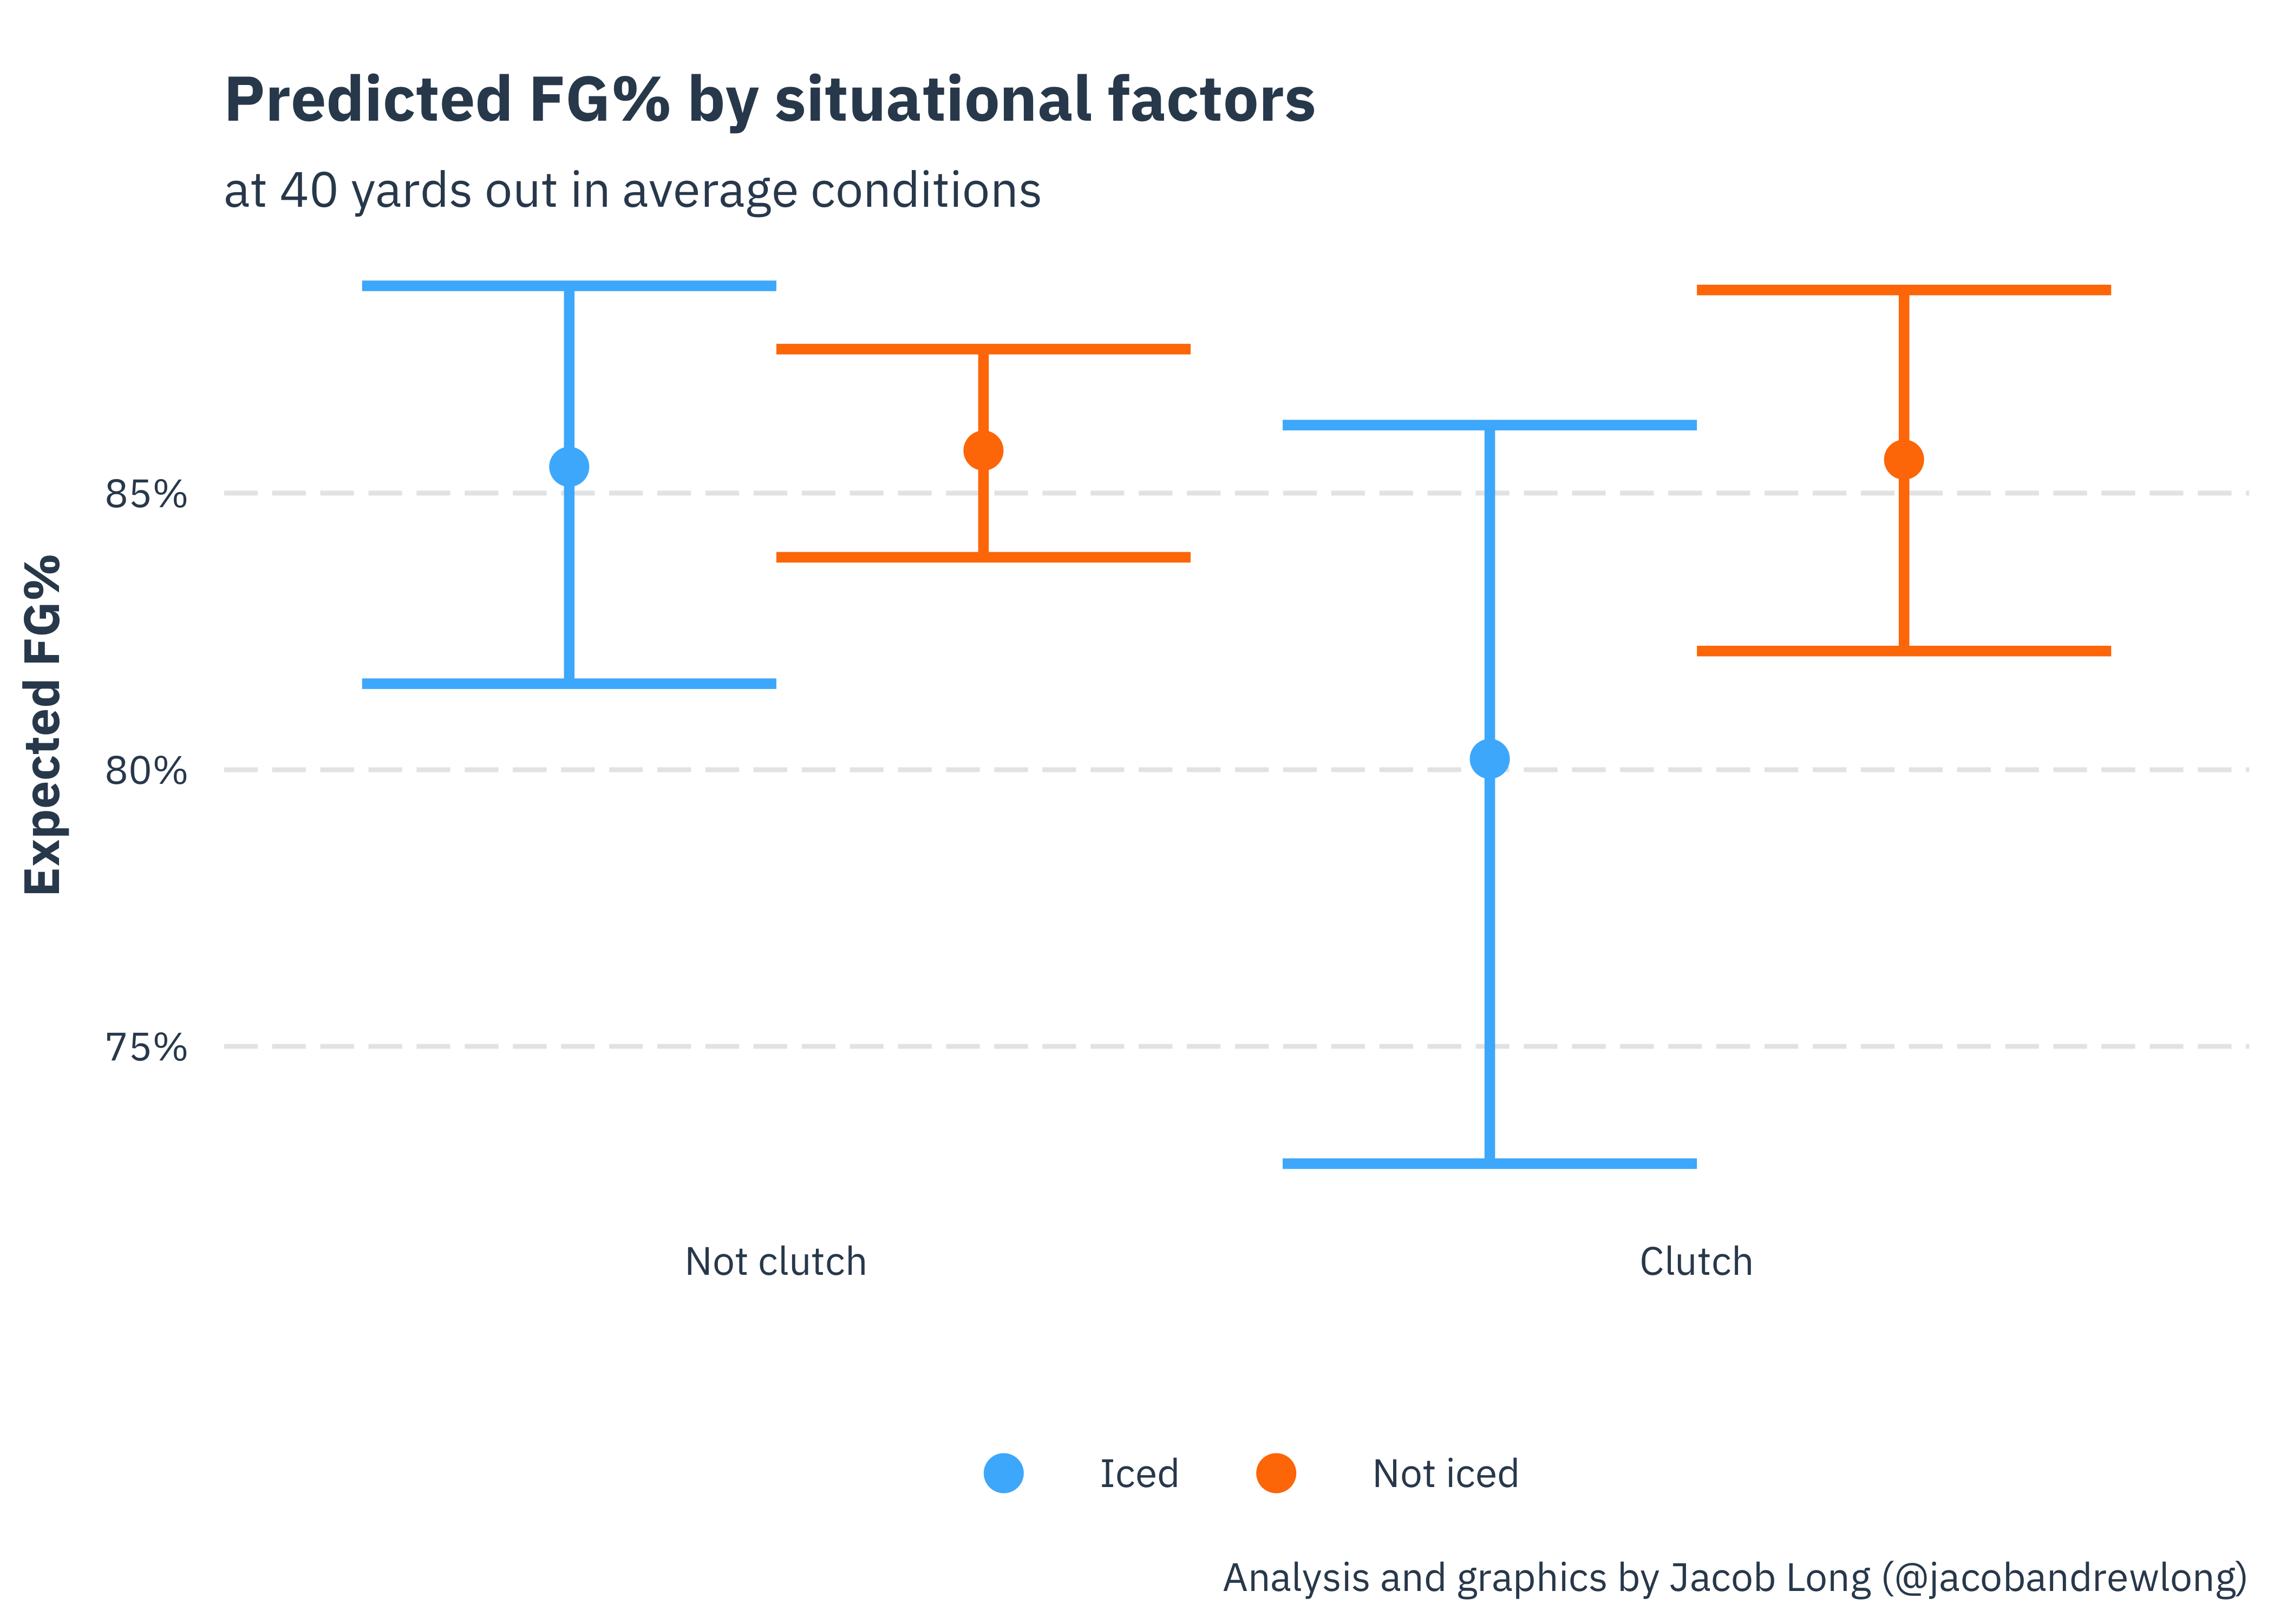
What we see is that 3 out of 4 situations have basically the same predicted probability of success, at about 85%. But when the kicker is iced and it’s a clutch kick, the predicted probability of success is 80%, consistent with an effect of icing the kicker. That being said, the confidence intervals show that because there aren’t that many kicks that fit this definition, the model isn’t very sure whether the probability of success is that much lower.
Statistically, the model implies a 91% chance that icing a kicker late in a close game reduces the chances of a make somewhat. If I was a coach, I’d take this as good enough information to keep trying it in those situations where the timeouts couldn’t be used in any other productive way. That being said, I wouldn’t blow the timeout if my team had hopes of getting the ball back and trying to make a late charge down the field.
Odds and ends
Wind
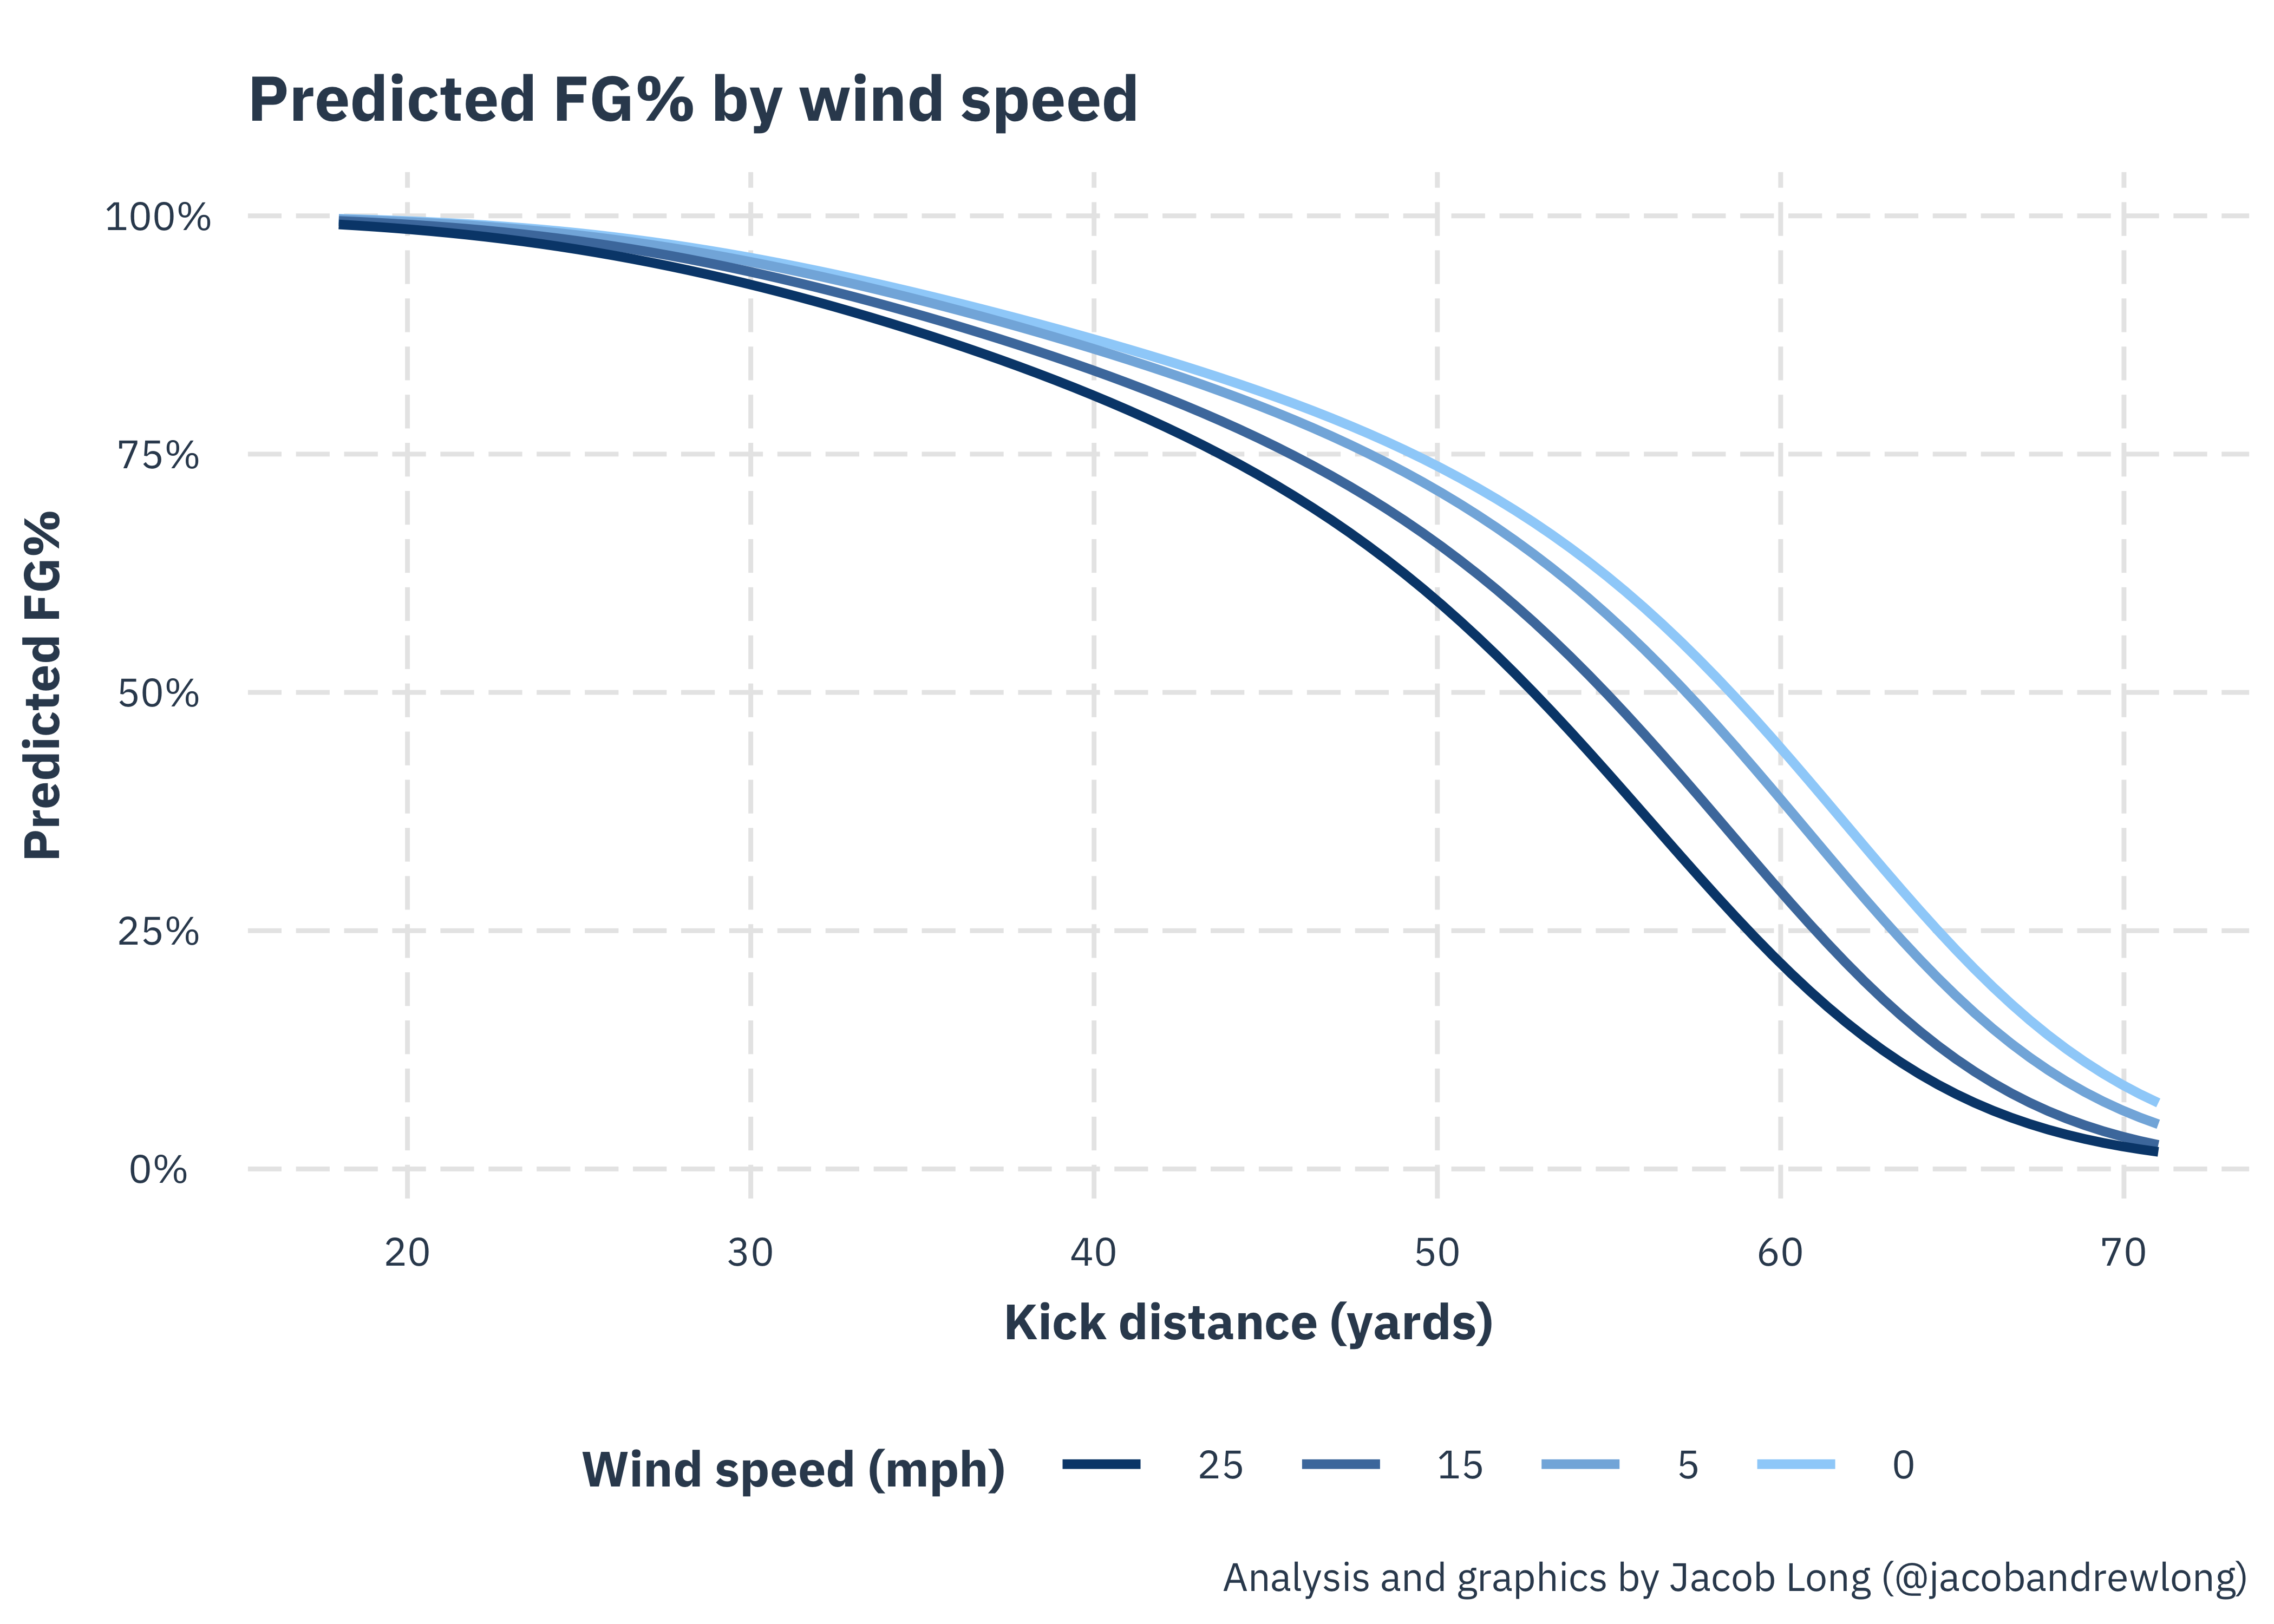
Yes, wind appears to typically make it hard to kick and those effects do seem to multiply as the distance gets longer. Of course, as mentioned earlier, I didn’t find the cross-wind data to be reliable enough to deal with the possible cases of tailwind, the only case where the wind may help.
Given that stadiums probably tend to have swirling winds, I don’t know that it’s very common for kickers to have a helpful wind.
Temperature
Temperature on the other hand does not seem to have much of an effect once controlling for other factors. That being said, this could be related to there being relatively few cold weather games or coaches being especially cautious in the cold.
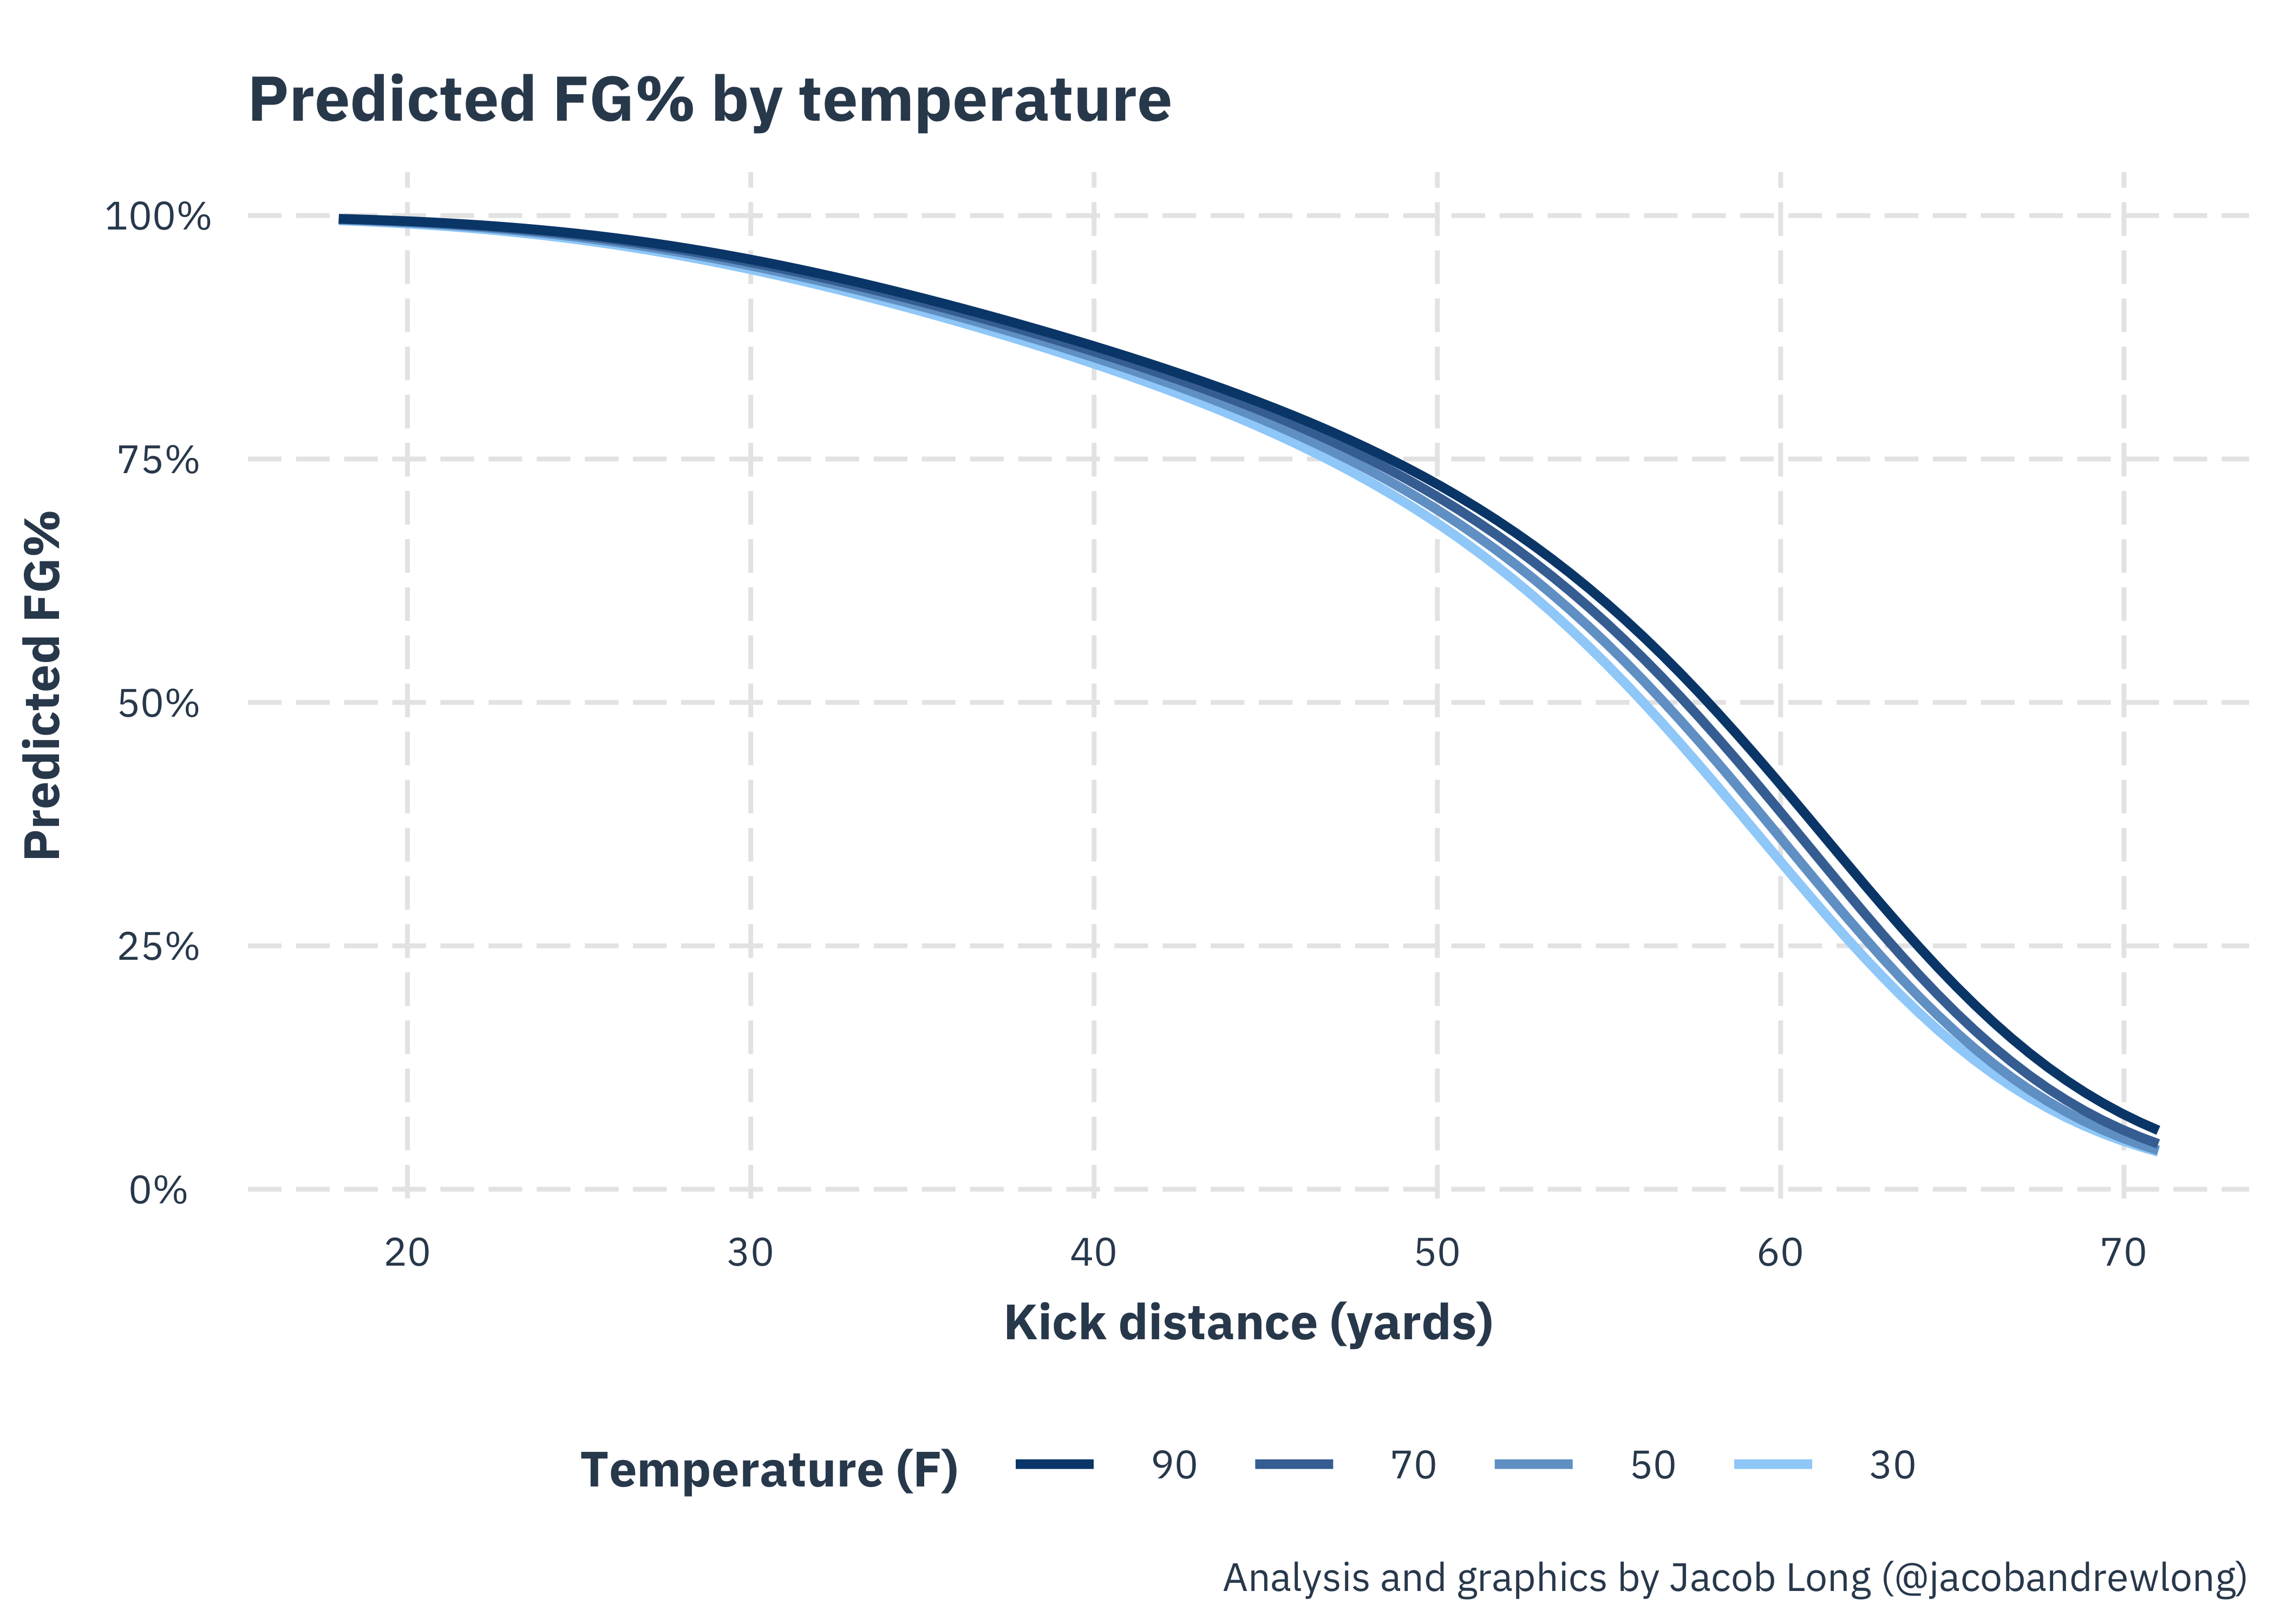
You can see the apparent effect is quite subtle.
Rain
The model overwhelmingly supports the proposition that rain makes kicks more difficult. Statistically, it is over 99% probable that this is the case and given that it makes so much sense, I see no reason to doubt it.
The rain effect is about two thirds of the replacement kicker effect, so it’s the equivalent of a quite meaningful kicker downgrade.
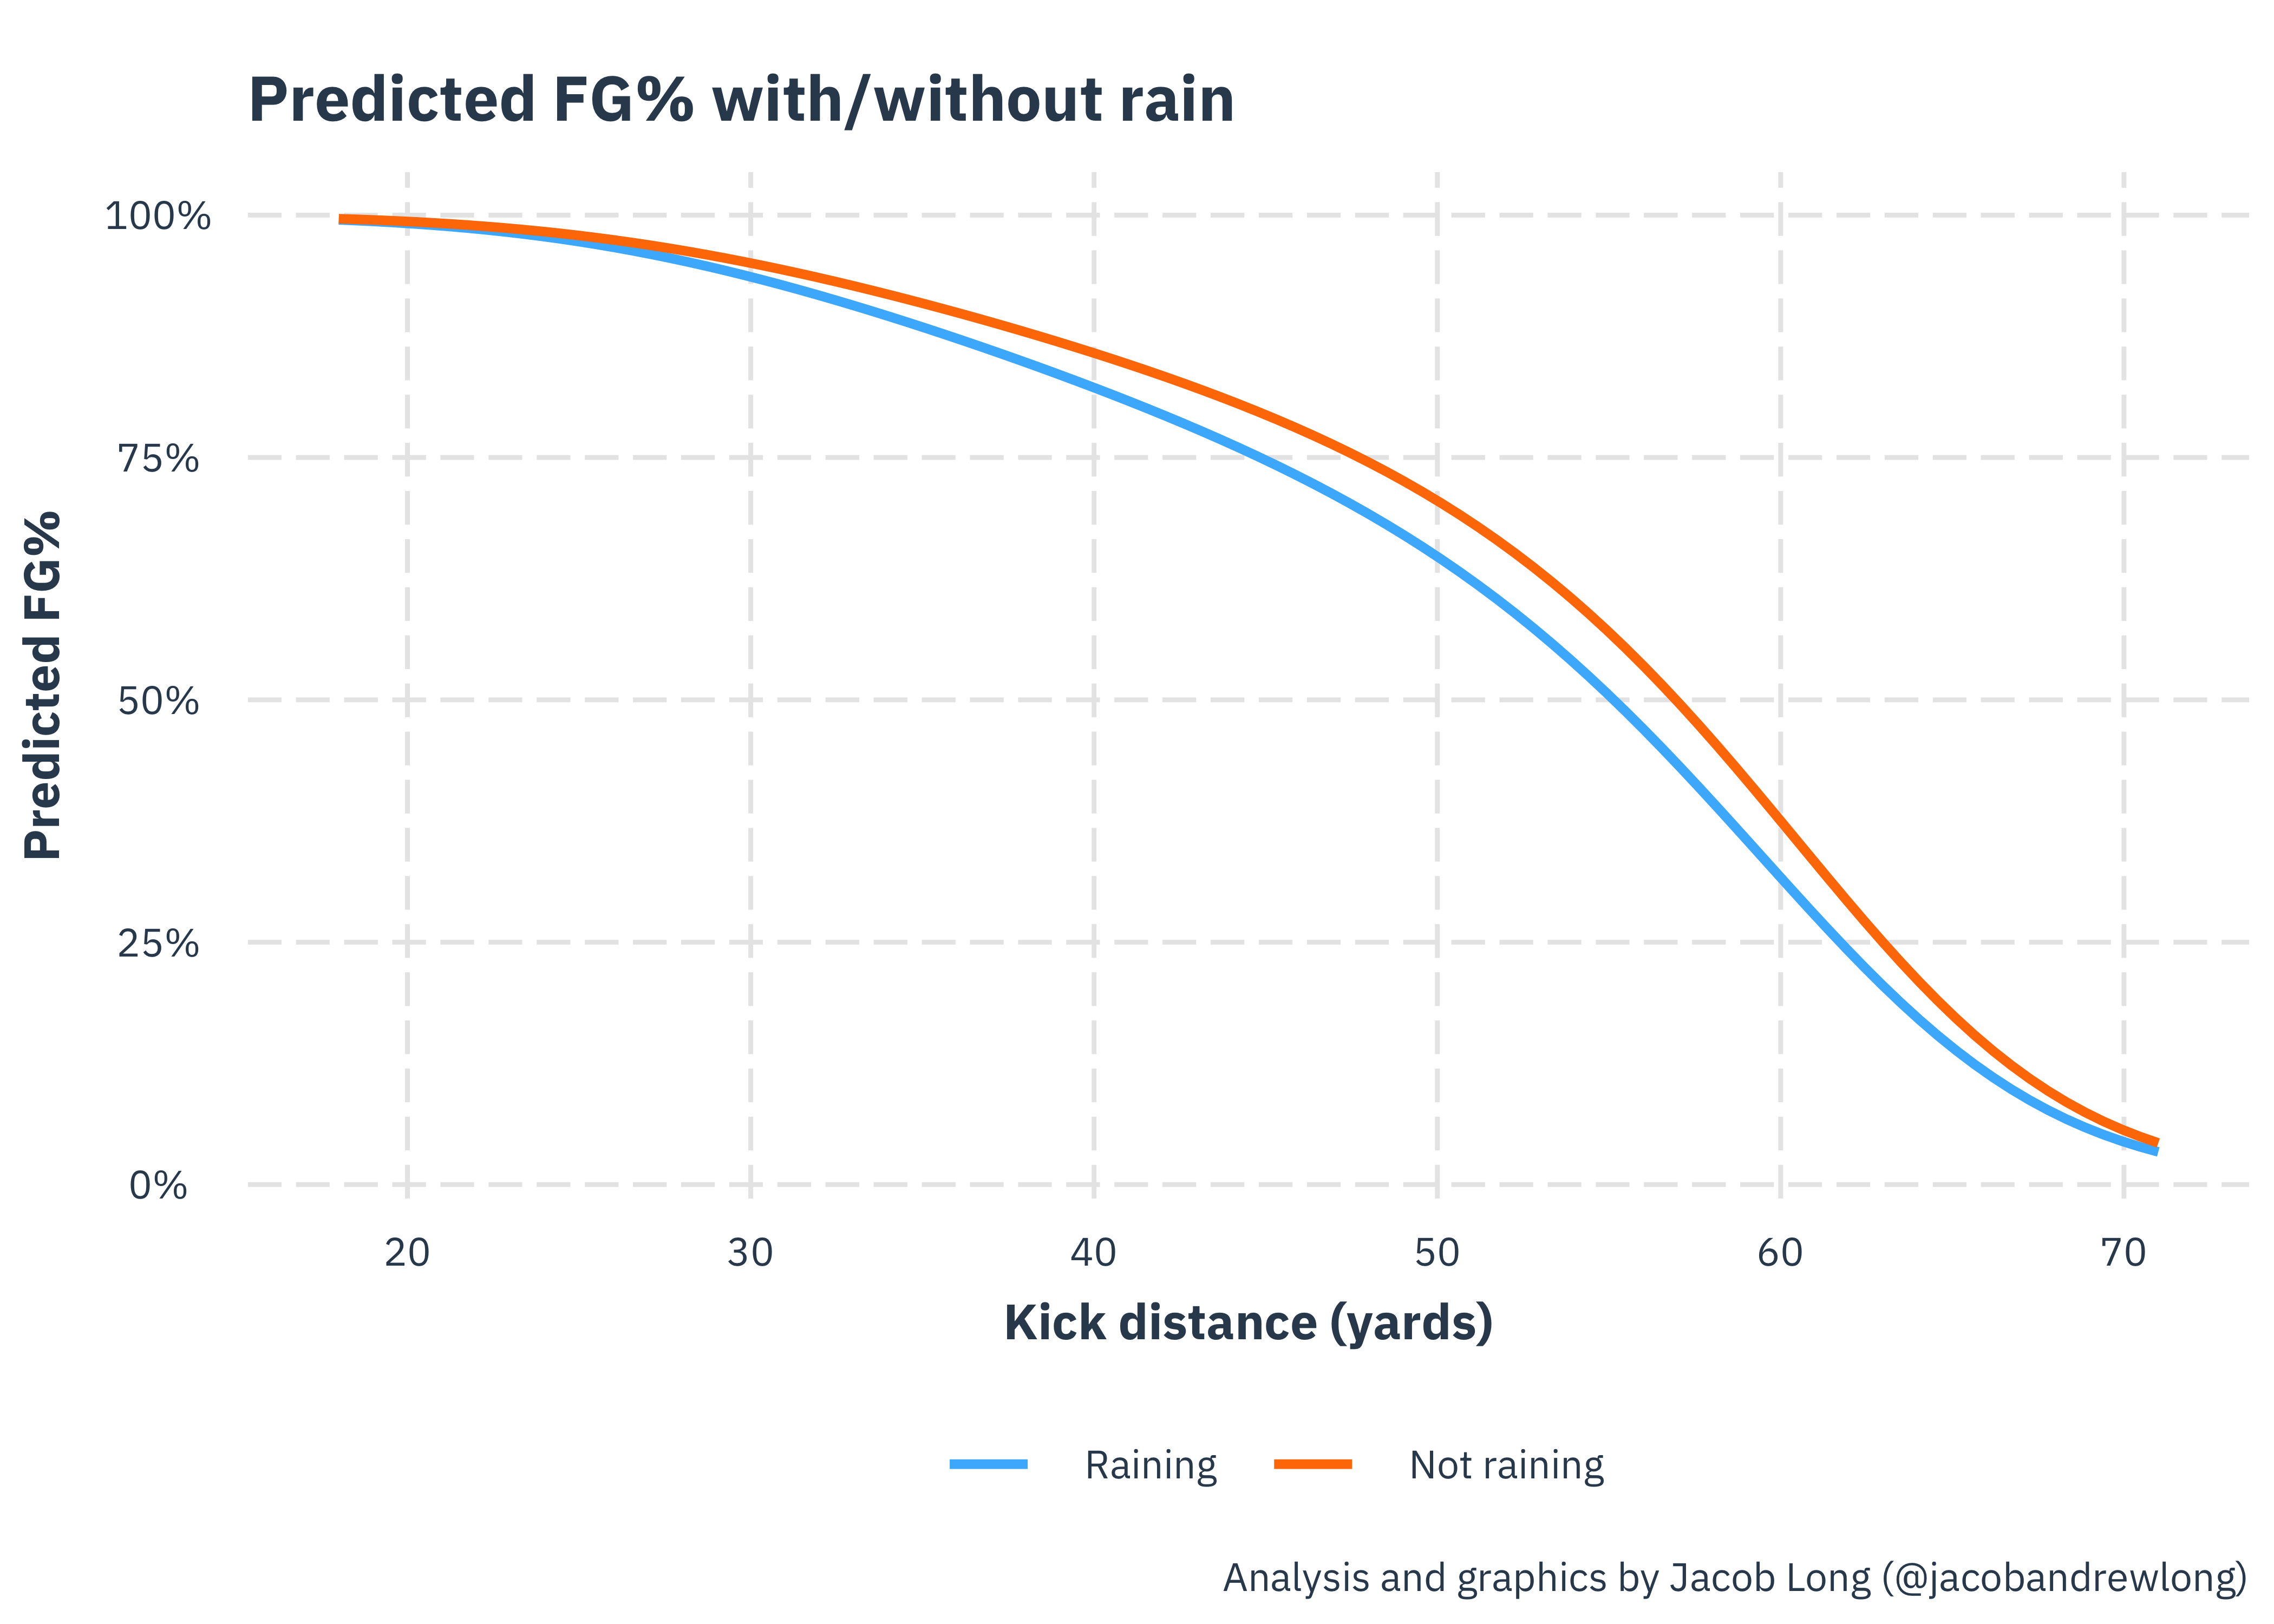
In plain terms, you’re going from an 86% chance of a 40 yarder to 82%. At 50 yards, it takes you from 71% to 65%.
Additionally, the effect of snow is approximately the same, but the model is much less sure about it — probably because there are so few kicks attempted in the snow.
Home kicker advantage
I don’t see any evidence of kickers doing better at home except by a trivial amount.
To be clear, I’m not abusing p values here; I’m talking about the posterior probability.↩︎